
GDP & personal income and expenditures
- 01.27.23
- Economy & Policy
- Commentary
Chief Economist Eugenio J. Alemán discusses current economic conditions.
The U.S. economy posted a growth rate of 2.1% in 2022 compared to 2021 after reporting an annualized quarter over quarter growth rate during the last quarter of the year of 2.9%. Economic growth slowed down considerably during this year compared to 2021 when growth surged by 5.9% compared to 2020. Although consumption was slower in the fourth quarter of the year than during the third quarter, increasing 2.1% versus 2.3% in the third quarter, goods consumption recovered from a fall of 0.4% in the third quarter to a growth rate of 1.1% during the last quarter of the year. Meanwhile, gross private domestic investment posted a growth rate of 1.4% in the fourth quarter after declining 9.6% in the third quarter. Nonresidential investment in structures made the difference during the last quarter of the year as it increased 0.4% after declining 3.6% in the third quarter of the year.
Importantly for the Federal Reserve and for inflation, the price index for GDP slowed down further, to 3.5% in the fourth quarter from a rate of 4.4% in the third quarter of the year. The slowdown in the price index for GDP was due to a slowdown in the price index for personal consumption expenditures (PCE), which slowed down to 3.2% during the quarter after posting a growth rate of 4.3% in the previous quarter. This slowdown in the price index for PCE was a consequence of a 1.5% decline in the price of goods, of which durable goods declined 3.1% while nondurable goods did so by 0.5%. Services prices, however, continued to increase at a slightly higher rate than in the third quarter. Services prices increased 5.6% in the last quarter of the year compared to an increase of 5.2% in the previous quarter.
Today’s report on personal income and expenditures shed some more insights on the state of the U.S. economy at the end of 2022 and the picture is not very positive, even with the strong growth in the fourth quarter. What the personal income and expenditures showed that the U.S. consumer did all expenditures in October and very little during the last months of the year. In fact, both nominal and real consumption expenditures (PCE) declined in November and December while October’s print was very strong. That is, all consumption in the fourth quarter of the year occurred in the first month of that quarter.
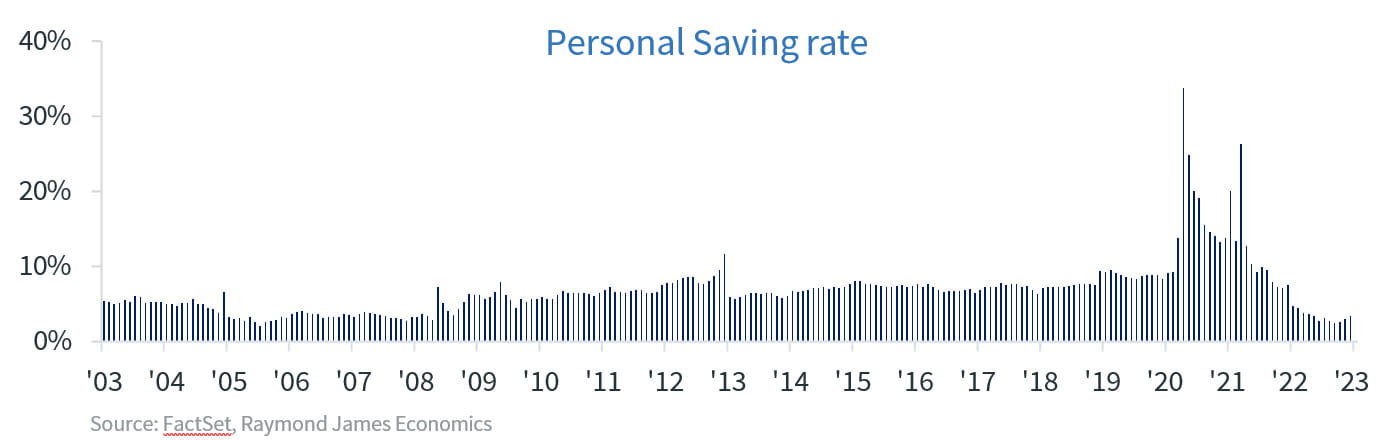
This means that the New Year is starting on down note regarding consumption expenditures, i.e., the American consumer. The not so negative part was that disposable personal income, both nominal as well as real, remained in positive territory during the entire quarter, which meant that the personal savings rate, that is, savings as a percentage of disposable personal income, increased during the quarter after hitting the lowest rate since 2005 in September of 2022. The personal saving rate increased from 2.4% in September of 2022 to 3.4% in December.
There is high inflation. And then, there is the price of eggs!
Before we discuss what has happened to egg prices over the last year or so, we need to get some definitions straight. Inflation is not measured by what happens to the price of one good. Inflation is a generalized increase in the price level. Inflation does not mean that all the prices are going up during a period of time. Inflation means that some prices went up while some prices went down and probably some other prices did not change. However, in the aggregate, that is, summing across all the prices and averaging them out in the economy, prices increased overall.
Furthermore, some prices are more important than others because they command a larger share of incomes. That is, a rise in the price of pencils is less damaging than an increase in the prices of rentals, etc. At the same time, if the price of one good increases too much, we may be able to shy away from consuming that good so higher prices on that good does not affect us. However, there are other goods that we need to consume and that we cannot shy away from, at least not in the short to medium term.
Egg prices are not as glamorous as gasoline prices. Why? Because if egg prices are very high, as they are today, we just eat something else. However, if gasoline prices are very high today, there is little we can do about it because we have to go to work and we have to fill up and drive our gas guzzling SUVs. Perhaps one of the only exceptions regarding eggs is if you are a diehard keto dieter or a low carb dieter, which means you eat more eggs per day than anybody else, and thus it is very hard to substitute away from eggs if you remain on this diet.
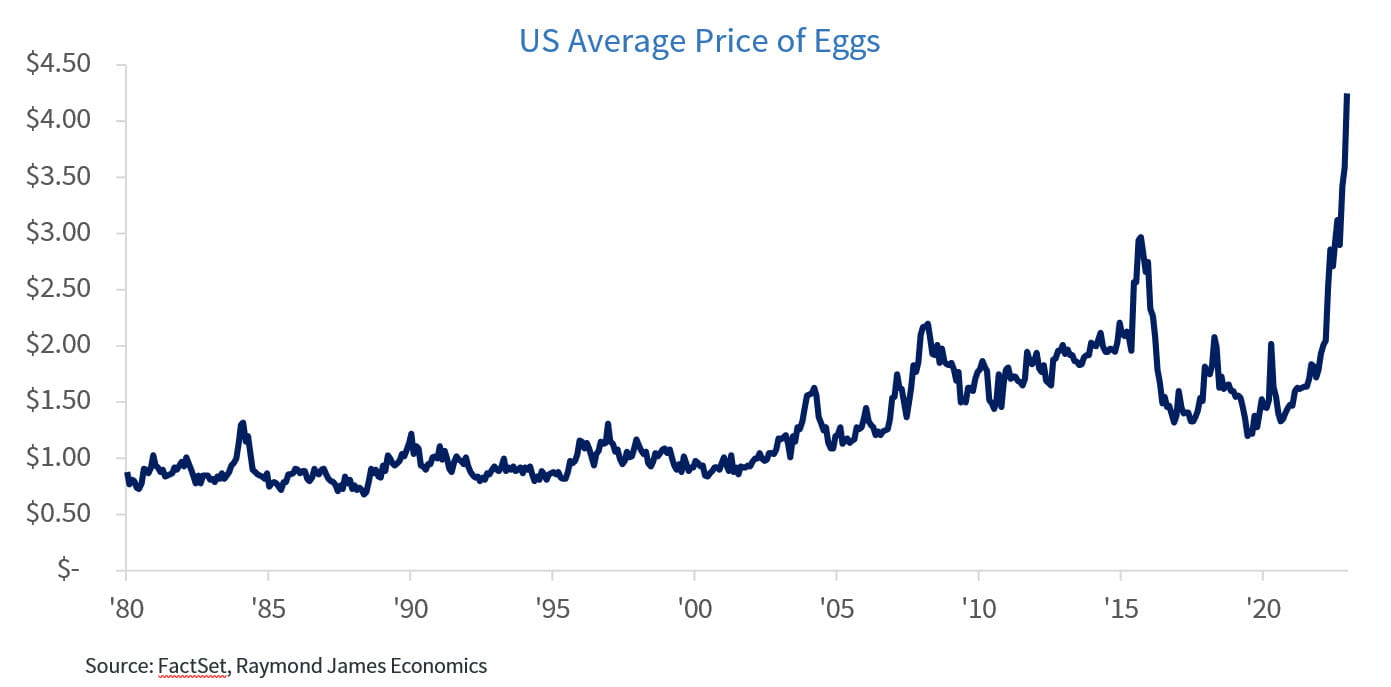
If you cannot substitute away from eggs in your diet, then you are in trouble. However, our take is that there are very few Americans that have this issue. But even if you cannot substitute away from eggs, you have probably noticed that the price for a dozen eggs has increased by triple digits since a year ago. On the production side things are different. A bakery cannot substitute eggs for similar inputs in the production of their goods so they will have to continue to pass these higher prices into final product prices.
Normally, food and especially agricultural products which are typically non-durable food items, often experience volatile prices due to a multitude of reasons, including weather, droughts, floods, epidemics, etc. In fact, food prices since 1958 have been, on average, 1.5x more volatile than the broader core prices (prices excluding food and energy), but egg prices have been 12x more volatile than broader core prices!
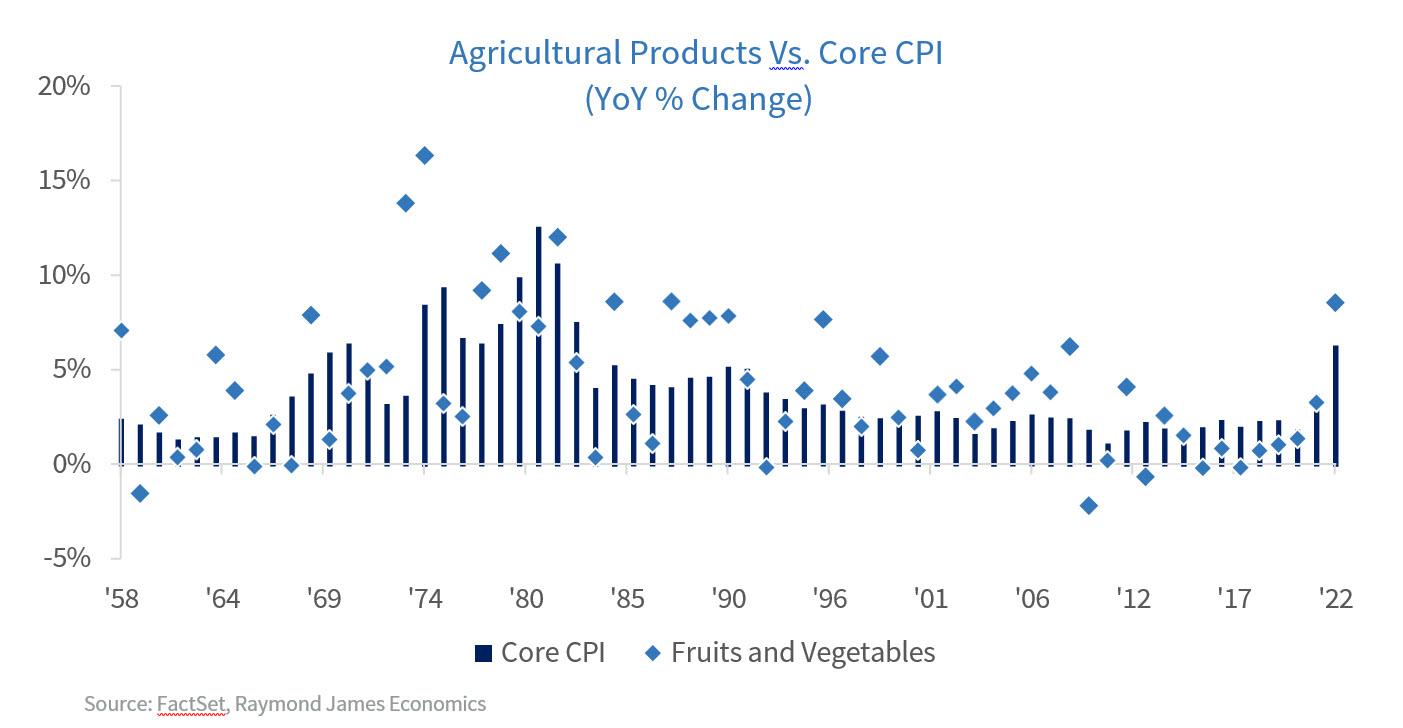
While there are arguments being made to the Federal Trade Commission that industry leaders have been engaging in price gouging, we are limiting ourselves to the fact that in 2022, approximately 60 million chickens and turkeys were killed by the avian influenza—bird flu—outbreak and this has led to a decline in production. In addition to the bird flu, we experienced soaring seed, fertilizer, and energy costs due to the Russia-Ukraine war for most of 2022, which pushed costs for farmers even higher. However, this isn’t the first time that prices of eggs have spiked more than 25% year-over-year, and just like most agricultural products, there are external factors that can be held responsible for the price increase as shown in the chart below.
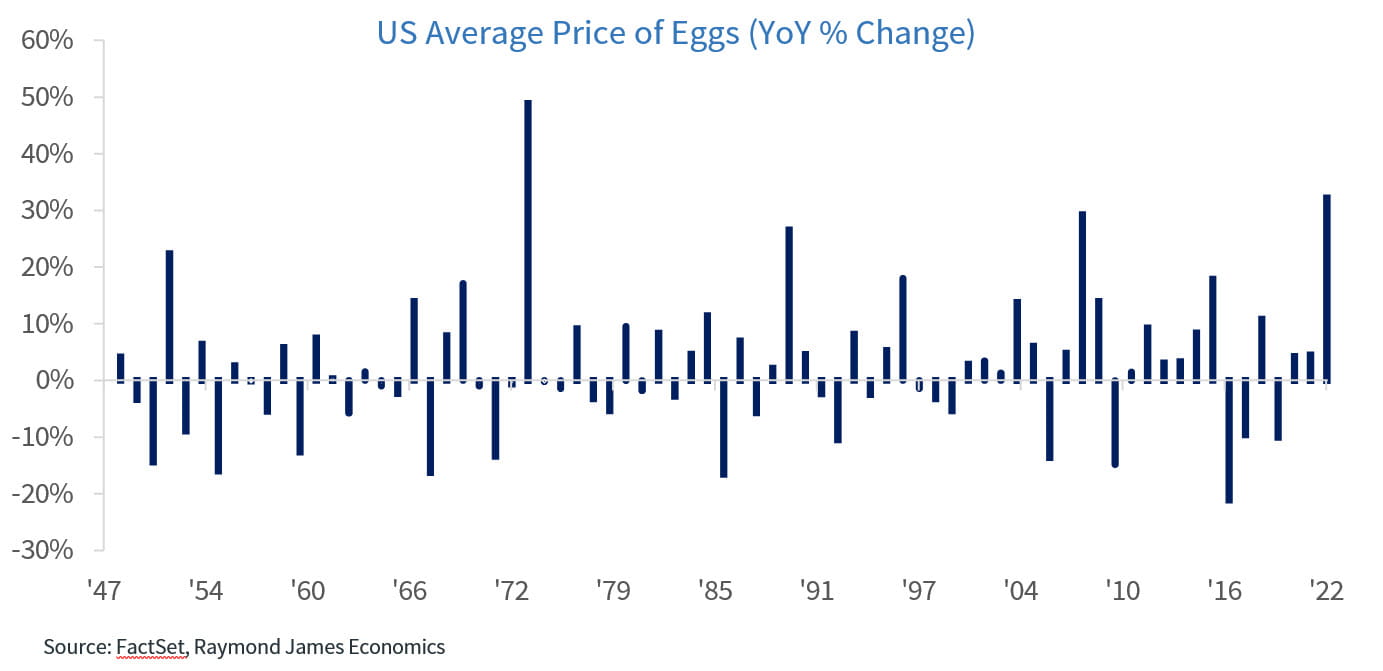
Whether it was an increase in feed prices (1973, 2005), adverse weather (1989), or the avian flu (2015, 2022), the good news is that prices of eggs have not remained high after spiking. Today, we are experiencing a perfect storm with all the factors above hitting at almost the same time, and therefore the price of eggs might remain elevated for a bit longer, but ultimately should cool down.
Economic and market conditions are subject to change.
Opinions are those of Investment Strategy and not necessarily those of Raymond James and are subject to change without notice. The information has been obtained from sources considered to be reliable, but we do not guarantee that the foregoing material is accurate or complete. There is no assurance any of the trends mentioned will continue or forecasts will occur. Last performance may not be indicative of future results.
Consumer Price Index is a measure of inflation compiled by the U.S. Bureau of Labor Statistics. Currencies investing is generally considered speculative because of the significant potential for investment loss. Their markets are likely to be volatile and there may be sharp price fluctuations even during periods when prices overall are rising.
Consumer Sentiment is a consumer confidence index published monthly by the University of Michigan. The index is normalized to have a value of 100 in the first quarter of 1966. Each month at least 500 telephone interviews are conducted of a contiguous United States sample.
Personal Consumption Expenditures Price Index (PCE): The PCE is a measure of the prices that people living in the United States, or those buying on their behalf, pay for goods and services. The change in the PCE price index is known for capturing inflation (or deflation) across a wide range of consumer expenses and reflecting changes in consumer behavior.
The Consumer Confidence Index (CCI) is a survey, administered by The Conference Board, that measures how optimistic or pessimistic consumers are regarding their expected financial situation. A value above 100 signals a boost in the consumers’ confidence towards the future economic situation, as a consequence of which they are less prone to save, and more inclined to consume. The opposite applies to values under 100.
Leading Economic Index: The Conference Board Leading Economic Index is an American economic leading indicator intended to forecast future economic activity. It is calculated by The Conference Board, a non- governmental organization, which determines the value of the index from the values of ten key variables
Certified Financial Planner Board of Standards Inc. owns the certification marks CFP®, Certified Financial Planner™, CFP® (with plaque design) and CFP® (with flame design) in the U.S., which it awards to individuals who successfully complete CFP Board's initial and ongoing certification requirements.
Links are being provided for information purposes only. Raymond James is not affiliated with and does not endorse, authorize or sponsor any of the listed websites or their respective sponsors. Raymond James is not responsible for the content of any website or the collection or use of information regarding any website's users and/or members.
GDP Price Index: A measure of inflation in the prices of goods and services produced in the United States. The gross domestic product price index includes the prices of U.S. goods and services exported to other countries. The prices that Americans pay for imports aren't part of this index.
FHFA House Price Index: The FHFA House Price Index is the nation’s only collection of public, freely available house price indexes that measure changes in single-family home values based on data from all 50 states and over 400 American cities that extend back to the mid-1970s.
Expectations Index: The Expectations Index is a component of the Consumer Confidence Index® (CCI), which is published each month by the Conference Board. The CCI reflects consumers' short-term—that is, six- month—outlook for, and sentiment about, the performance of the overall economy as it affects them.
Present Situation Index: The Present Situation Index is an indicator of consumer sentiment about current business and job market conditions. Combined with the Expectations Index, the Present Situation Index makes up the monthly Consumer Confidence Index.
Pending Home Sales Index: The Pending Home Sales Index (PHS), a leading indicator of housing activity, measures housing contract activity, and is based on signed real estate contracts for existing single-family homes, condos, and co-ops. Because a home goes under contract a month or two before it is sold, the Pending Home Sales Index generally leads Existing-Home Sales by a month or two.
DISCLOSURES
Import Price Index: The import price index measure price changes in goods or services purchased from abroad by
U.S. residents (imports) and sold to foreign buyers (exports). The indexes are updated once a month by the Bureau of Labor Statistics (BLS) International Price Program (IPP).
ISM New Orders Index: ISM New Order Index shows the number of new orders from customers of manufacturing firms reported by survey respondents compared to the previous month.ISM Employment Index: The ISM Manufacturing Employment Index is a component of the Manufacturing Purchasing Managers Index and reflects employment changes from industrial companies.
ISM Inventories Index: The ISM manufacturing index is a composite index that gives equal weighting to new orders, production, employment, supplier deliveries, and inventories.
ISM Production Index: The ISM manufacturing index or PMI measures the change in production levels across the
U.S. economy from month to month.
ISM Services PMI Index: The Institute of Supply Management (ISM) Non-Manufacturing Purchasing Managers' Index (PMI) (also known as the ISM Services PMI) report on Business, a composite index is calculated as an indicator of the overall economic condition for the non-manufacturing sector.
Source: FactSet, data as of 12/29/2022
