
Why so much pushback on a December rate cut?
- 10.31.25
- Economy & Policy
- Commentary
Chief Economist Eugenio J. Alemán discusses current economic conditions.
Markets were taken by surprise by Federal Reserve (Fed) Chair Powell’s strong suggestion that a rate cut in December is not a certainty, as they were sure they were going to get one at December’s Federal Open Market Committee (FOMC) meeting. During the press conference, Powell reiterated several times that an interest rate cut in December was not a “foregone conclusion,” and when the press conference was over, markets were trying to digest the reasons for such a strong pushback from the Fed chair.
Typically, the Fed does not want to contradict the markets and aligns with what markets are expecting. This time around, however, the uncertainty around the path forward pushed the Fed Chairman to confront market expectations head-on, something the Fed chair has seldom done before. There were probably several reasons for the pushback. One of these has to do with internal FOMC discussions, which he said reflected large disagreements between members of the Fed. So wide was the disagreement that of the two FOMC members opposed to the decision, one wanted a 50 basis point reduction in the federal funds rate, while the other dissenter wanted no change.
The second reason is probably related to the government shutdown and what it is doing to economic data releases. Although the Fed chair indicated that the Fed is not driving completely blind, as it has access to private data releases, initial jobless claims, and job openings coming from individual states, and information it gets from the Beige book, the disagreement is probably related to the lack of information compared to periods when data was flowing. Thus, it seems that many members wanted to take a step back and wait to study the effects of the 150 basis point reduction in the federal funds rate last year before proceeding with more cuts.
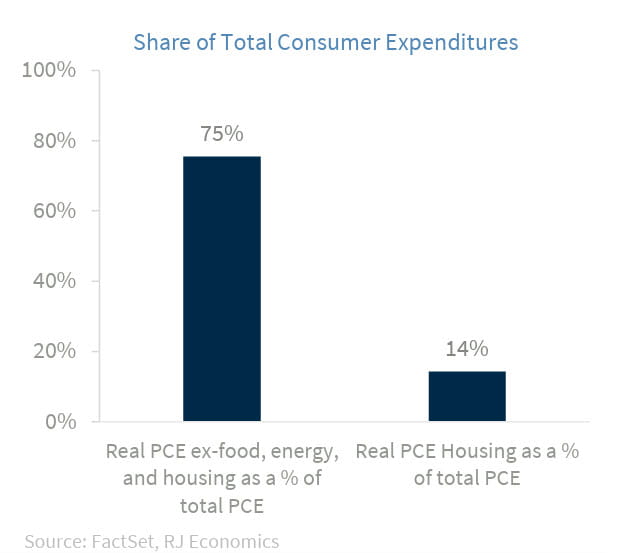
Third, although the pre-tariff disinflationary process is still alive and well, the risks for a sustained increase in inflation have increased, according to some of the members of the Fed. The next three graphs show why this may be the case. The first graph shows real personal consumption expenditures (PCE) segmented into two broad categories. The first category is real PCE excluding food, energy, and housing consumption as a percentage of total real PCE. The second category is real PCE in housing as a percentage of total real PCE. The first bar shows that real PCE excluding food, energy, and housing represents 75% of total PCE, while the second bar shows that real PCE in housing accounts for just 14% of total real PCE.
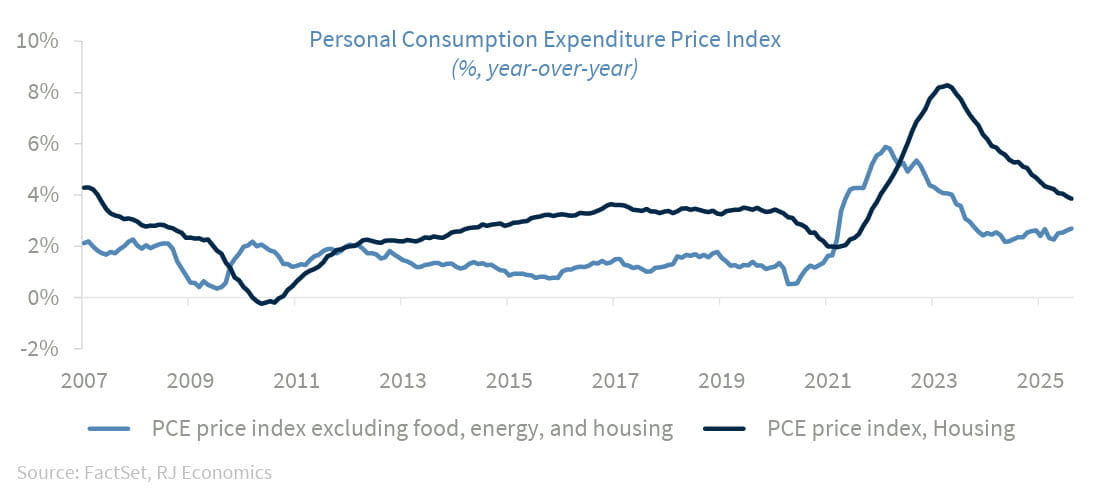
The second graph shows how the prices of these components of real PCE have moved over the years. As we can see, although housing prices have continued to move down on a year-over-year basis, and we expect this trend to continue during the next year, prices of goods excluding food, energy and housing are moving up. Recall that these prices represent 75 percent of total consumption, so Fed members are concerned that this could become a problem. So far, this increase in prices excluding food, energy and housing has not been followed by increases in housing prices, but the Fed is not convinced that this will continue to be the case and would like to err on the side of caution.
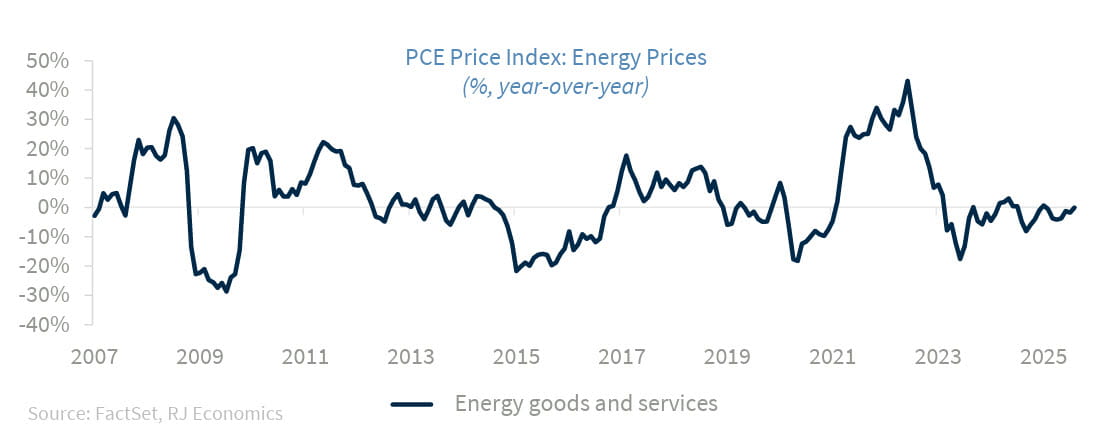
The third graph shows the evolution of the price of energy goods and services. In this graph, we can see that energy prices have had a flat-to-deflationary effect on inflation since early 2023, which, if sustained, will help keep overall prices contained. However, this is not a sure thing and is probably one of the reasons why many Fed members may want to wait and be more cautious.
Although we understand these risks and why Fed officials pushed back on the certainty of another rate cut in December, we still believe that, barring a large upward surprise from energy and/or housing prices, there is still a high probability that the Fed will lower rates again in December.
Economic and market conditions are subject to change.
Opinions are those of Investment Strategy and not necessarily those of Raymond James and are subject to change without notice. The information has been obtained from sources considered to be reliable, but we do not guarantee that the foregoing material is accurate or complete. There is no assurance any of the trends mentioned will continue or forecasts will occur. Past performance may not be indicative of future results.
Consumer Price Index is a measure of inflation compiled by the US Bureau of Labor Statistics. Currencies investing is generally considered speculative because of the significant potential for investment loss. Their markets are likely to be volatile and there may be sharp price fluctuations even during periods when prices overall are rising.
Consumer Sentiment is a consumer confidence index published monthly by the University of Michigan. The index is normalized to have a value of 100 in the first quarter of 1966. Each month at least 500 telephone interviews are conducted of a contiguous United States sample.
Personal Consumption Expenditures Price Index (PCE): The PCE is a measure of the prices that people living in the United States, or those buying on their behalf, pay for goods and services. The change in the PCE price index is known for capturing inflation (or deflation) across a wide range of consumer expenses and reflecting changes in consumer behavior.
The Consumer Confidence Index (CCI) is a survey, administered by The Conference Board, that measures how optimistic or pessimistic consumers are regarding their expected financial situation. A value above 100 signals a boost in the consumers’ confidence towards the future economic situation, as a consequence of which they are less prone to save, and more inclined to consume. The opposite applies to values under 100.
Certified Financial Planner Board of Standards Center for Financial Planning, Inc. owns and licenses the certification marks CFP®, CERTIFIED FINANCIAL PLANNER®, and CFP® (with plaque design) in the United States to Certified Financial Planner Board of Standards, Inc., which authorizes individuals who successfully complete the organization’s initial and ongoing certification requirements to use the certification marks.
Links are being provided for information purposes only. Raymond James is not affiliated with and does not endorse, authorize or sponsor any of the listed websites or their respective sponsors. Raymond James is not responsible for the content of any website or the collection or use of information regarding any website's users and/or members.
GDP Price Index: A measure of inflation in the prices of goods and services produced in the United States. The gross domestic product price index includes the prices of U.S. goods and services exported to other countries. The prices that Americans pay for imports aren't part of this index.
Employment cost Index: The Employment Cost Index (ECI) measures the change in the hourly labor cost to employers over time. The ECI uses a fixed “basket” of labor to produce a pure cost change, free from the effects of workers moving between occupations and industries and includes both the cost of wages and salaries and the cost of benefits.
US Dollar Index: The US Dollar Index is an index of the value of the United States dollar relative to a basket of foreign currencies, often referred to as a basket of U.S. trade partners' currencies. The Index goes up when the U.S. dollar gains "strength" when compared to other currencies.
The FHFA HPI is a broad measure of the movement of single-family house prices. The FHFA HPI is a weighted, repeat- sales index, meaning that it measures average price changes in repeat sales or refinancings on the same properties.
Import Price Index: The import price index measure price changes in goods or services purchased from abroad by U.S. residents (imports) and sold to foreign buyers (exports). The indexes are updated once a month by the Bureau of Labor Statistics (BLS) International Price Program (IPP).
ISM Services PMI Index: The Institute of Supply Management (ISM) Non-Manufacturing Purchasing Managers' Index (PMI) (also known as the ISM Services PMI) report on Business, a composite index is calculated as an indicator of the overall economic condition for the non-manufacturing sector.
The ISM Manufacturing Index: The GDP Now Institute of Supply Management (ISM) Manufacturing Measures the health of the manufacturing sector by surveying purchasing managers at manufacturing firms. The survey asks about current business conditions and expectations for the future, including new orders, inventories, employment, and deliveries.
Consumer Price Index (CPI) A consumer price index is a price index, the price of a weighted average market basket of consumer goods and services purchased by households.
Producer Price Index: A producer price index (PPI) is a price index that measures the average changes in prices received by domestic producers for their output.
Industrial production: Industrial production is a measure of output of the industrial sector of the economy. The industrial sector includes manufacturing, mining, and utilities. Although these sectors contribute only a small portion of gross domestic product, they are highly sensitive to interest rates and consumer demand.
The NAHB/Wells Fargo Housing Opportunity Index (HOI) for a given area is defined as the share of homes sold in that area that would have been affordable to a family earning the local median income, based on standard mortgage underwriting criteria.
Conference Board Coincident Economic Index: The Composite Index of Coincident Indicators is an index published by the Conference Board that provides a broad-based measurement of current economic conditions, helping economists, investors, and public policymakers to determine which phase of the business cycle the economy is currently experiencing.
Conference Board Lagging Economic Index: The Composite Index of Lagging Indicators is an index published monthly by the Conference Board, used to confirm and assess the direction of the economy's movements over recent months.
New Export Index: The PMI New export orders index allows us to track international demand for a country's goods and services on a timely, monthly, basis.
Gold is subject to the special risks associated with investing in precious metals, including but not limited to: price may be subject to wide fluctuation; the market is relatively limited; the sources are concentrated in countries that have the potential for instability; and the market is unregulated.
The Conference Board Leading Economic Index: Intended to forecast future economic activity, it is calculated from the values of ten key variables.
Source: FactSet, data as of 10/17/2025
